
Home prices continue to reach records as interest rates climb to highs not seen since the 2008 financial crisis. The Federal Reserve is transitioning between Quantitative Easing (QE) and Quantitative Tightening (QT) to push interest rates to rise in order to combat inflation. QE was able to combat recessionary pressures that occurred as businesses laid off millions of workers during the early days of the pandemic. While QE was able to stave off a recession, this loose monetary policy continued for 2 years as low-interest rates and a record number of stimmies caused inflation to reach highs not seen since the 1980s.
Home Price Growth
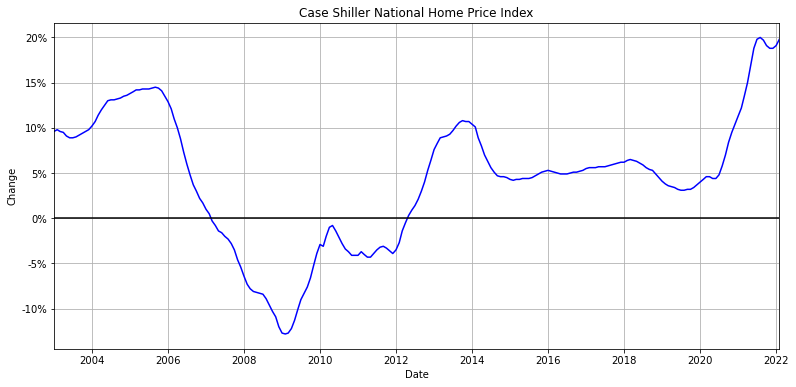
The Case-Shiller National Home Price Index measures the growth rate of single-family home prices in the United States. Home prices grew by 20.2% YoY in February which is a higher rate of 19.1% YoY seen in January. The index has a base value of 100 in the year 2000 and has measured home price growth for over 20 years. Median new home prices rose to $436.7k in March which is up from $421.6k in February. Median existing home prices rose to $375.3k in March which is up from $359.3k in February.
Home prices are set to tick higher as more buyers rushed into the market to lock in low-interest rates. The Case-Shiller Index takes into account deals that already have been made so there is a lag of a few months. The number of home buyers could decline but home prices may remain high due to a lack of inventory.
Interest Rates
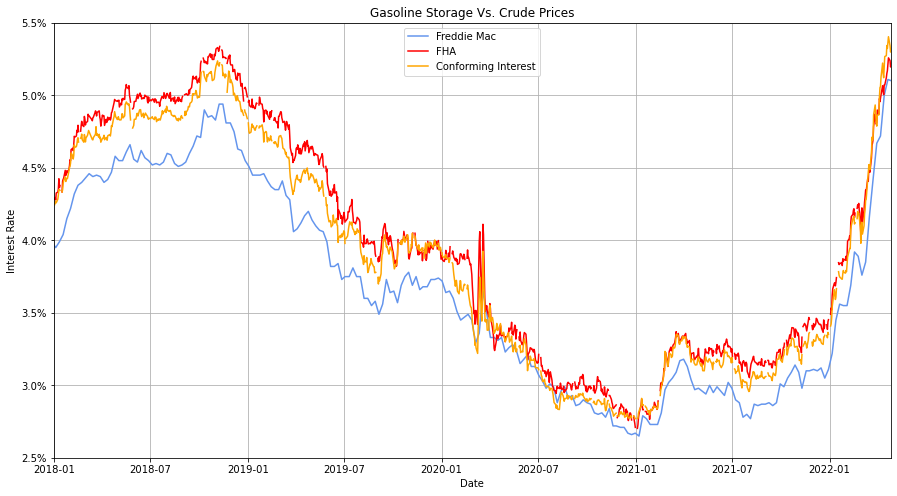
Interest rates reached lows not seen since the 2008 Financial Crisis during the height of the pandemic. Mortgage rates reached an average of approximately 2.7% at the end of 2020 in an effort to spur home buying. These low rates had the desired effect as millions of people and private investors bought homes at a record pace.
Rising interest rates picked up speed in 2022 when the Fed announced that inflation was no longer transitory even as inflation reached 7%. Inflation is currently at 8.6% but neglects to consider several factors that keep this figure artificially low. The official CPI is kept artificially low in an effort to reduce things like Social Security payments which rise with official inflation numbers or i-bonds interest payments that also pay rates based on the CPI.
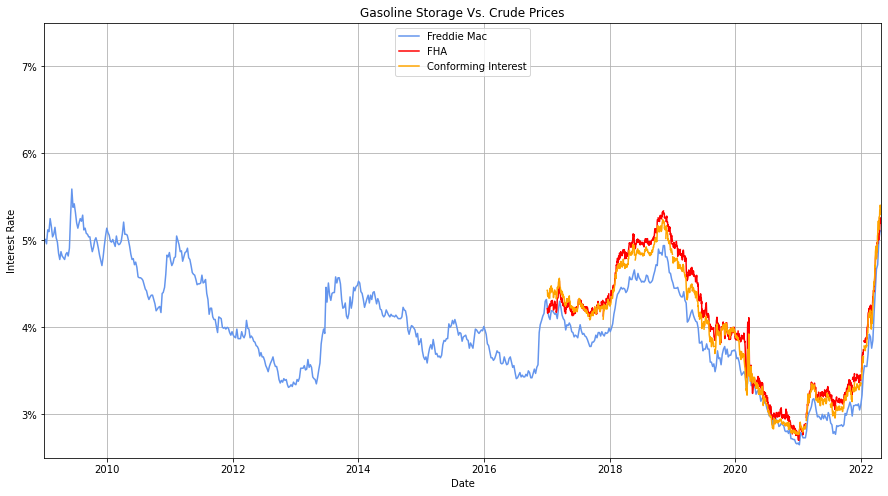
In an effort to combat inflation, the Federal Reserve raised mortgage interest rates to an average of approximately 5.2% which is up from an average of approximately 2.7% at the of 2020. This is the highest it has been in a decade and is close to a 2009 high of 5.59%. A higher interest rate actually prices out several home buyers as a 2.5% interest rate rise on a $300,000 could add more than $500 a month. Not only do higher interest rates price out potential home buyers, but the higher home prices also make it more expensive for the bottom 50% of the country to afford to stay in the home they already own. This prices out buyers that struggle to get a mortgage as they cannot get a loan due to the higher cost. This leads to a lower number of home buyers and eventually reduces home prices.
Monthly Supply of Homes
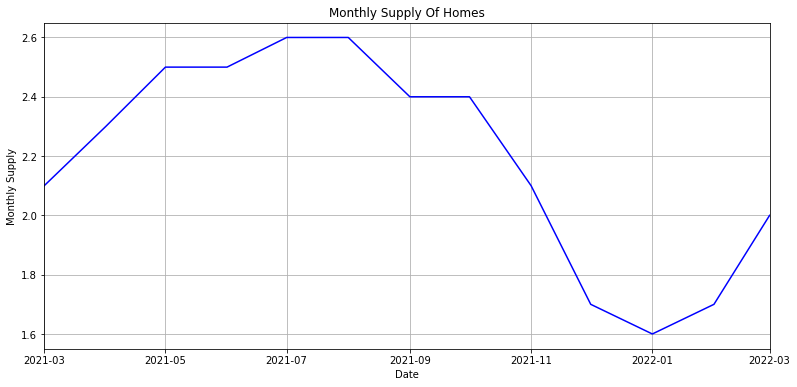
The monthly supply of homes ticked up from a record low of 1.6 months to 2 months. This is still well below a healthy housing inventory and highlights the imbalance that has occurred in the housing market since interest rates fell below 3%. Housing starts are at a 3.9% rise YoY and residential permits are up 6.6% YoY which is below historical norms but still above what they were during the height of the 2008 Financial Crisis.
Existing Homes For Sale
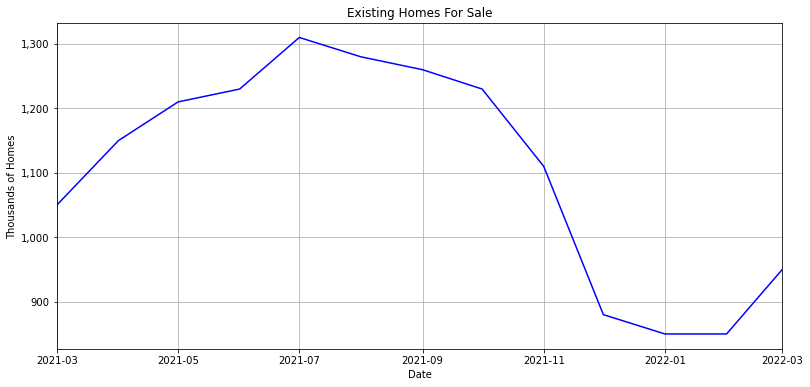
Existing home inventories rose to 950k in March which is up from 850k in February. This is down from 1.310 million homes near the end of 2021 but has been rising in the past few months. Existing home sales fell 4.5% YoY in March and are down -2.7% from February.
New homes Sold
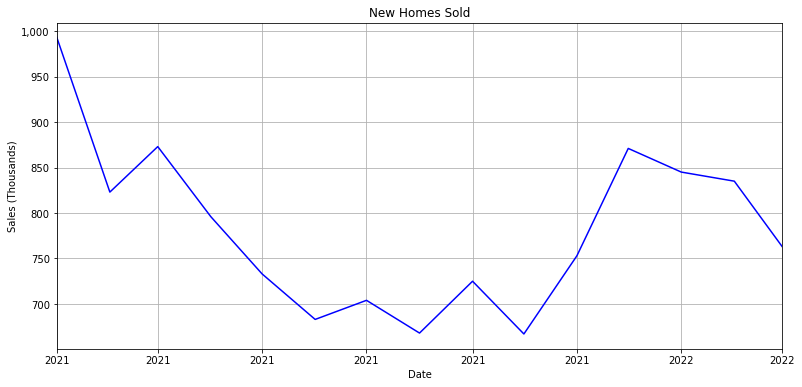
New home sales fell to 763k in March from 835k in February. This is down from approximately 1.4 million homes in 2005 before the housing crisis crippled the economy and is below 993k homes sold at the beginning of 2021 as the current housing market peaked. This number is expected to continue to decline as interest rates continue to rise.
Existing Home Sold
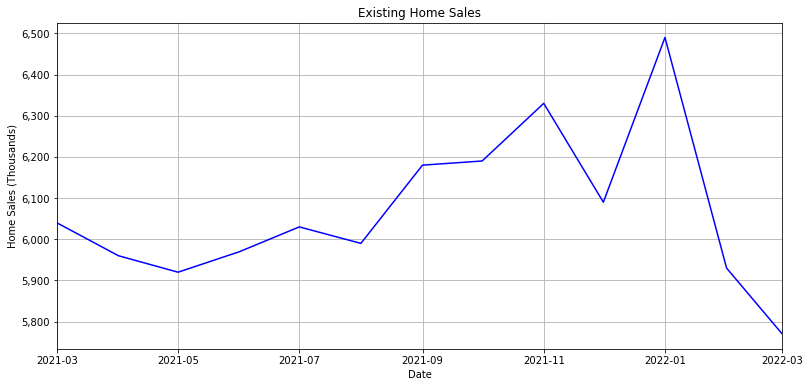
Existing home sales dropped to approximately 5.77 million homes in March which are down from approximately 5.93 million homes in February. This is also down from 6.49 million homes at the beginning of 2022 when they reached their peak. This could be an indication of a larger trend or it could be that there are not enough existing homes for sale. Since the monthly housing supply is extremely low, the housing market is still relatively healthy but a trend could be forming as many buyers are priced out of the market.
Owners Equivalent
Rent has been rising as home prices rise across the country. The CPI is calculated using an Owner’s Equivalent Rent rather than the actual rise in home prices. Rents typically rise at a slower pace than home prices which undermines official CPI inflation. Owner’s Equivalent Rent is what a home would actually rent for vs actual change in rents.
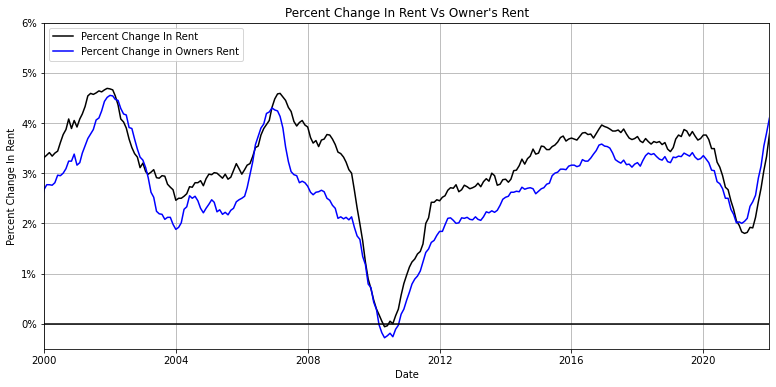
Owner’s Equivalent Rent is rising faster than actual rent prices because owners of rental properties are confident they can charge more for their property. This is because QE flooded the market with dollars while lowering the interest rates to historic lows which led to higher home prices. This rise in OER will only add to inflation at a time of rising commodity prices, salaries, and services.
These barometers are an indicator that inflation is unlikely to subside unless the Federal Reserve completely collapses the economy. The Fed raised interest rates by 50 basis points which is in addition to 25 basis points it raised last time it met. This will do very little to combat the effects of QE as Americans are still spending at record amounts.