
New labor data released this week underscores the health of the labor market even as people sit out the rise in the number of available jobs. The Labor Department reported that the United States added 467,000 jobs in January which is an indication of a strong labor market. This comes even as the Omicron variant swept through the country which likely blunted employers’ plans to hire new employees.
The data that was released in February indicates that the labor market remains strong even as the Federal Reserve gets set to raise rates several times this year. This data indicates that the labor market will likely be able to withstand any taper tantrum or new Covid variant that will impact hiring. These labor market indicators reveal the current situation of the labor market.
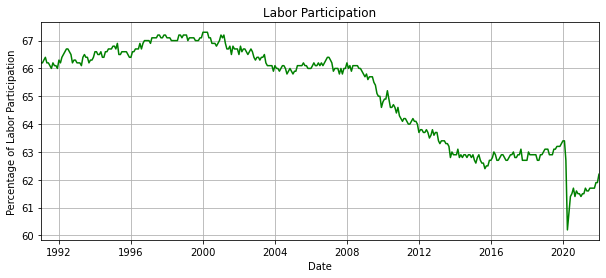
The current labor participation rate is still below the pandemic but is currently rising. Before the pandemic, labor participation was above 63% but fell to 60.2% during the pandemic. This number has struggled to rise as people have left the workforce and have not been enticed to return. Employees that left the workforce after the 2008 Financial Crisis did not return to the labor market even as the economy was likely at full employment in 2019. The labor participation rate was at 66% in 2008 and dropped to below 63% before gaining strength in 2019. Even with the economy at full employment, the labor participation rate did not rise to where it was in 2019. It’s unlikely that the labor participation rate will increase as the pandemic is overdue to people dropping out of the labor force, people not needing to work, and Boomers retiring early.
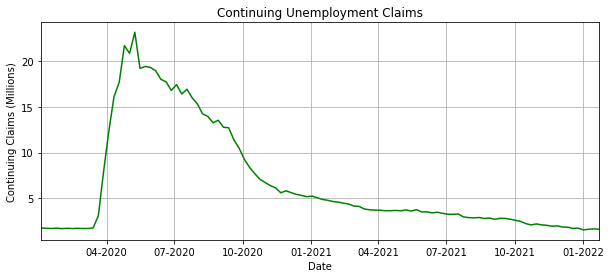
Continuing unemployment claims are claims made by people who have filed an initial claim who are covered by unemployment insurance and receiving benefits. The number of people filing continuing claims of unemployment rose to 23.13 million as the pandemic took its toll on the economy and workers dropped out of the labor force. These claims dropped to 1.63 million this week, which underscores the health of the labor market. This is below the 1.71 million people seeking more benefits in February of 2020 before the pandemic. This number is likely to level off as the number of layoffs remains low but will remain subdued.
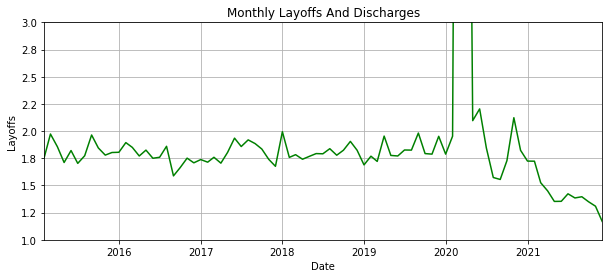
Private-sector layoffs left up to 13 million per month in March of 2020 during the beginning of the pandemic. Once the initial shock of the pandemic hit employers began to fade, the layoffs began to decline and have reached 1.1 million in January. This layoff rate is lower than the pre-pandemic levels which is another indication that the labor market is healthy.
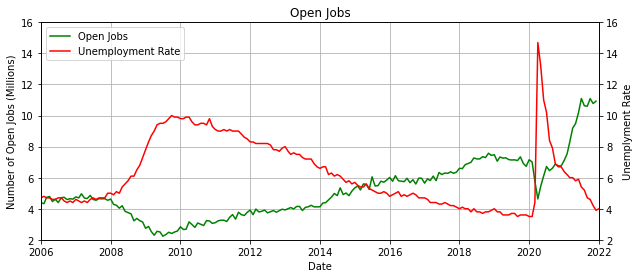
Another signal of the health of the labor market is the number of open jobs vs the unemployment rate. The official unemployment rate dropped to 4.0% in January. This is slightly higher than the 3.5% and there are fewer people in the labor market today, but it’s still low by historical standards. There are 10.9 million jobs that are available today which means that there are plenty of options for employees to move up. This many open jobs means that employers are eager to hire new employees which bodes well for anyone looking for a job.
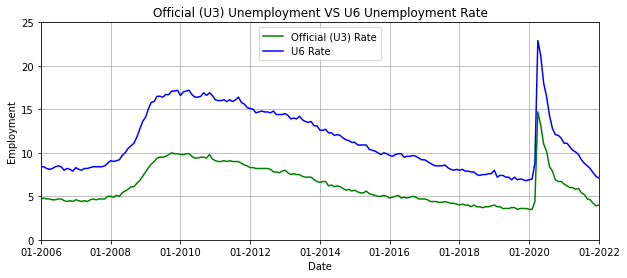
The official unemployment rate is 4.0% but this does not count the number of people that dropped out of the labor force or the underemployed. The U-6 Unemployment Rate takes into account workers that have dropped out of the labor market and the underemployed and is considered a better measure of the labor market. These discouraged workers and underemployed Americans are critical to determining the health of the labor market because this could add slack in the market as more people join the labor force during good times. The official unemployment is 4.0% today vs 3.5% before the pandemic and the U-6 Unemployment Rate is 7.1% today vs 6.9% before the pandemic. This signals that it’s in a healthy range and is even lower than before the 2008 Financial Crisis.
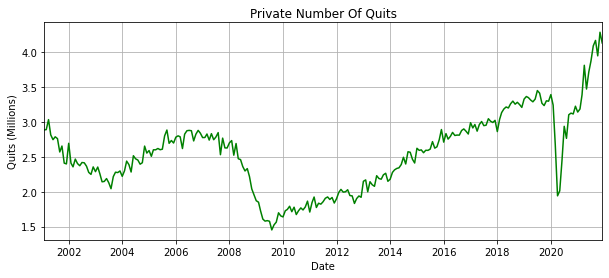
The rate of employees quitting their jobs is another measure of the health of the labor market. The quits rate has risen to 4 million employees in January for the private sector. This is higher than the 1.5 million during the 2008 Financial Crisis and the 2 million during the beginning of the pandemic. This is one of the highest measures of confidence Americans have in the labor market. As they get more confident, they quit their jobs and look for something new. When the economy stumbles, they are less likely to quit but when it rebounds they tend to look for something that pays more than their previous job.
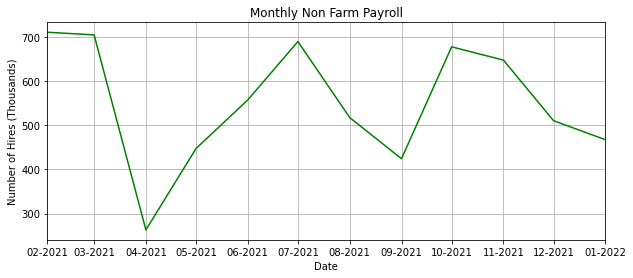
Monthly non-farm payrolls are historically extraordinarily high. It was understood that non-farm payrolls would jump after employment leveled out because millions of Americans would be rehired after being laid off. But payrolls have remained elevated for months and look set to have momentum for the next few months at least.
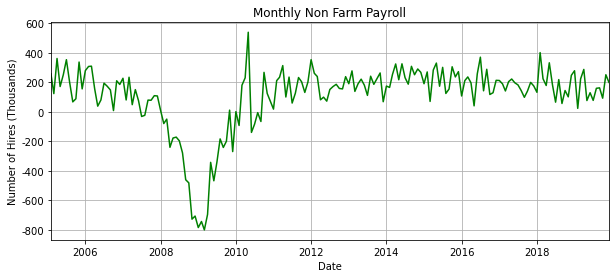
Monthly non-farm payrolls were hit hard after the 2008 Financial Crisis when millions of Americans lost their jobs. The labor market struggled to regain those lost jobs even after the government spent trillions of dollars to stabilize the market. The labor market took years to recover from the lows seen in 2009 and even longer for the labor market to stabilize.
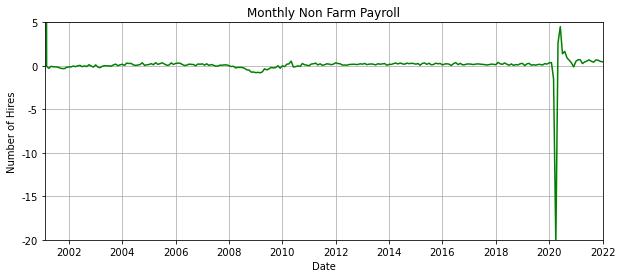
But the 2008 Financial Crisis was a blip compared to the pandemic. At the beginning of the pandemic, employers shed jobs as education, travel, leisure, and service companies laid off millions of employees. The severity of the 2008 Financial Crisis was not even visible on the graph when taking into account the pandemic. But Congress shelled out $7 trillion to prop up the economy and now the market is white-hot.
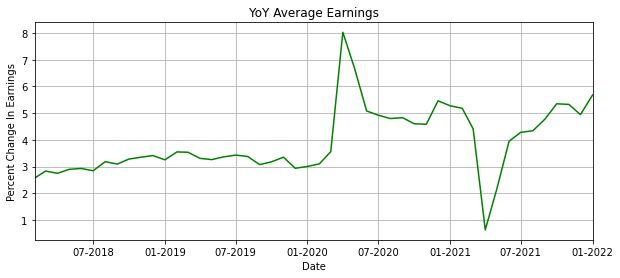
The final barometer for the strength of the labor market is the pace at which wages rise. The rate of year-on-year changes in wages has risen since the beginning of the pandemic and now keeps up with inflation. Wages were rising at approximately 3% before the pandemic which was more than enough to keep up with inflation. Wages rose by 5.7% in January vs a year ago which is close to the official inflation rates of 7%. This rise in wages indicates that employers are willing to pay more for their employees which is a great indicator of the strength of the labor markets.
These economic indicators point to a strengthening labor market even as the Fed will announce rate rises to combat inflation.